
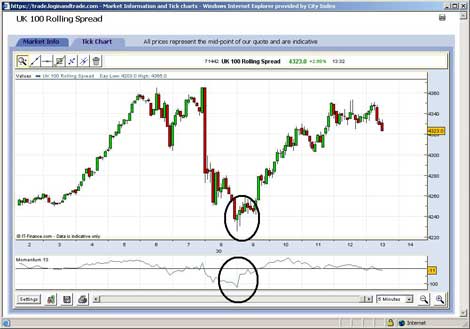
"At times it is better to be out, wanting to be in, than be in, wishing you were out" S Jadeja. The quote above reflects well the constant dilemma that faces an active trader. If I enter the market now, what can I lose? We constantly monitor ourselves for impatience, greed as well as fear. Overtrading in particular is a problem for many traders, experienced or otherwise. Waiting for the right signal can be as testing for your patience as being in the trade. In this article we will discuss a price analysis tool called Candlestick analysis, and combine it with an indicator called Momentum. Momentum is a simple indicator showing the difference between the current closing price and the close N periods ago. On the chart below we are using 5-min bars. Momentum in general refers to prices continuing to trend. The momentum indicator shows the trend by remaining positive while an uptrend is sustained or negative while a downtrend is sustained. A crossing up through zero may be used as a signal to buy, or a crossing down through zero as a signal to sell. Alternatively you can use an abrupt trend change in Momentum as confirmation that a price pattern signal has formed. A price pattern signal can be something as simple as a bar where the close and the open are equal or almost equal. The bars you are seeing on the chart are called "Candlestick" bars. They display the same data as a bar chart, namely the open, the high of the bar, the lows of the bar, and the close. However, a Candlestick is given a color, depending on whether the close is higher or lower than the open. If the close is higher than the open, it is given a green color. Otherwise the bar is red. A particularly popular pattern is the Doji, where the open and close is almost the same. In this instance, the sellers pressed the market lower than the previous bar, but were unable to close the bar at the lows. Instead buyers began to exceed the supply into the market, and the close was near the open. This is a classical reversal pattern in Candlechart terminology, but on its own, it is not particular reliable. However, if you get a confirmation from a sharp reversal in Momentum as well, you increase the odds significantly for a profitable trade. You should enter the market once the next bar trades above the high of the previous bar. Your stop-loss should be placed just below the low of the reversal bar. The philosophy here is to increase the probability of success in our trading by having more than one reason for executing a trade. In this case we had a momentum and price signal. Use our CFD and Spread Betting trading platforms or CFD simulator and Spread Betting simulator to access TA charting tools.
GOOGLE SEARCH

Custom Search