
Yes, it's true, you can trade the forex markets for free and using the same state-of-the-art software packages that professional Forex traders, around the world, are currently using to make real-time, live currency trades.
And you can also experience the same dynamic market action and go through the same process of making decisions based on breaking news, reacting to charting patterns, and tracking ones performance the same way professional Forex traders do.
And all this can be done even if you don't put any real money into your account, you won't see any difference in how the market behaves and how you react to the market. In short, at some point, every new forex trader needs to start Demo-trading.
Once you start placing demo trades, you will learn a lot about how Forex transactions are placed. I can't emphasize you enough, that this is a very important step for you in order to be able to learn how to become a trader. A demo account allows one to become familiar with trading procedures, such as placing Market, Limit, Stop, OCO Orders without any risk. All dollar losses or gains on a demo account are imaginary but, as mentioned above, the trading experience you acquire is not.
You should notice that making big gains in a demo-account does not guarantee profits in live trading; however, those who are not successful trading on paper rarely are successful when money is on the line. So, yes, just playing around and getting familiar with a demo account can be a great learning experience; however, you will not learn how to become a trader this way. You need to have a trading strategy.
Once you sign up for a mini-demo account, you will need to try one of the trial charting packages from the broker you choose. Any demo software you choose will do because they all have the necessary indicator tools you need. Once you have downloaded the software you can then set up your demo account and start drawing trendlines, marking support & resistance levels, monitoring moving averages, etc. This is also a very good way to get used to how orders are placed. Once you have a real trading system, you will already know how to place orders properly.
And remember, everyone makes mistakes placing orders. So you need to experiment before in a demo account so you can make your mistakes without losing any real money.
GOOGLE SEARCH

The United Arab Emirates' central bank set up new additional liquidity facility for commercial banks, it said on Sunday.
"Central Bank has issued a notice to UAE banks and branches of foreign banks operating in the UAE, making available to them a special additional liquidity facility linked to their current accounts at the central bank, at the rate of 50 basis points above the 3 months EIBOR (Emirates interbank offered rate)," it said in a statement.
The central bank also said it stood behind UAE banks and branches of foreign banks, adding the Gulf Arab country's banking system was more sound and liquid than a year ago.
Meanwhile, banks who lent over $30 billion to Dubai World, the debt-laden state investment group, plan to appoint auditors KPMG to represent them in talks over recovering their money, the Independent on Sunday newspaper reported.
Thirty global financial institutions have been selected for cross-border supervision exercises by regulators, the Financial Times reported on Monday.Compiled under the guidance of the Financial Stability Board (FSB), an international body of regulators and central bankers, the list is part of an effort to pre-empt the spread of systemic risks in the event of a future financial crisis.
Those featuring in the list will also be asked to write so-called "living wills" that outline plans to wind up banks in the aftermath of a crisis.
The FSB was established in the summer of 2009 to address the dangers posed by systemically-important, cross-border financial institutions through better supervision and co-ordination.
The foreign exchange market is the largest and most liquid financial market in the world. Traders include large banks, central banks, currency speculators, corporations, governments, and other financial institutions. The average daily volume in the global foreign exchange and related markets is continuously growing. Daily turnover was reported to be over US$3.2 trillion in April 2007 by the Bank for International Settlements. Since then, the market has continued to grow. According to Euromoney's annual FX Poll, volumes grew a further 41% between 2007 and 2008.
Of the $3.98 trillion daily global turnover, trading in London accounted for around $1.36 trillion, or 34.1% of the total, making London by far the global center for foreign exchange. In second and third places respectively, trading in New York accounted for 16.6%, and Tokyo accounted for 6.0%. In addition to "traditional" turnover, $2.1 trillion was traded in derivatives.
Exchange-traded FX futures contracts were introduced in 1972 at the Chicago Mercantile Exchange and are actively traded relative to most other futures contracts.
Several other developed countries also permit the trading of FX derivative products (like currency futures and options on currency futures) on their exchanges. All these developed countries already have fully convertible capital accounts. Most emerging countries do not permit FX derivative products on their exchanges in view of prevalent controls on the capital accounts. However, a few select emerging countries (e.g., Korea, South Africa, India—) have already successfully experimented with the currency futures exchanges, despite having some controls on the capital account.
FX futures volume has grown rapidly in recent years, and accounts for about 7% of the total foreign exchange market volume, according to The Wall Street Journal Europe (5/5/06, p. 20).
| Rank | Name | Market Share |
|---|---|---|
| 1 | 20.96% | |
| 2 | 14.58% | |
| 3 | 10.45% | |
| 4 | 8.19% | |
| 5 | 7.32% | |
| 6 | 5.43% | |
| 7 | 4.09% | |
| 8 | 3.35% | |
| 9 | 3.05% | |
| 10 | 2.26% |
Foreign exchange trading increased by 38% between April 2005 and April 2006 and has more than doubled since 2001. This is largely due to the growing importance of foreign exchange as an asset class and an increase in fund management assets, particularly of hedge funds and pension funds. The diverse selection of execution venues have made it easier for retail traders to trade in the foreign exchange market. In 2006, retail traders constituted over 2% of the whole FX market volumes with an average daily trade volume of over US$50-60 billion (see retail trading platforms) Because foreign exchange is an OTC market where brokers/dealers negotiate directly with one another, there is no central exchange or clearing house. The biggest geographic trading centre is the UK, primarily London, which according to IFSL estimates has increased its share of global turnover in traditional transactions from 31.3% in April 2004 to 34.1% in April 2007. The ten most active traders account for almost 80% of trading volume, according to the 2008 Euromoney FX survey. These large international banks continually provide the market with both bid (buy) and ask (sell) prices. The bid/ask spread is the difference between the price at which a bank or market maker will sell ("ask", or "offer") and the price at which a market taker will buy ("bid") from a wholesale or retail customer. The customer will buy from the market-maker at the higher "ask" price, and will sell at the lower "bid" price, thus giving up the "spread" as the cost of completing the trade. This spread is minimal for actively traded pairs of currencies, usually 0–3 pips. For example, the bid/ask quote of EUR/USD might be 1.2200/1.2203 on a retail broker. Minimum trading size for most deals is usually 100,000 units of base currency, which is a standard "lot".
These spreads might not apply to retail customers at banks, which will routinely mark up the difference to say 1.2100/1.2300 for transfers, or say 1.2000/1.2400 for banknotes or travelers' checks. Spot prices at market makers vary, but on EUR/USD are usually no more than 3 pips wide (i.e., 0.0003). Competition is greatly increased with larger transactions, and pip spreads shrink on the major pairs to as little as 1 to 2 pips.
MUMBAI: Dalal Street is likely to witness volatile trade this week with a downward bias taking cues from global markets as concerns about debt
 Tips to pick potential stocks | Tips for range-bound markets | Risk while investing in midcaps | Follow 20-20 rule for better returns |
Brokers said market had treaded into the overbought zone and needed a trigger to undergo correction. Weakness in the street may continue for the next few days, they said.
"The market will remain volatile and trade in negative terrain this week. As investor sentiment is weak in the market there will be some more sell off," Geojit BNP Paribas Financial Services Head, Research Centre, Alex Mathews said.
The market would now look for some announcement from the Dubai government about how it is planning to deal with the debt crisis, which revived fears of financial meltdown.
Global stocks declined last week as investors turned towards dollar as preferred investment on concerns over potential debt problem fall out at Dubai World.
"Indian markets have already felt knee jerk reaction of the Dubai crisis. In the short term although the crisis might keep the market under pressure, going ahead markets here will take its own direction," Unicon Financial Chief Executive Gajendra Nagpal said.
The Monday market opening is expected to move from flat to negative and then take cues from the Asian and European markets.
Over the week the Bombay Stock Exchange benchmark Sensex lost 390 points or 2.29 per cent to reach 16632.01 points. While foreign institutional investors witnessed a net sell off of Rs 577 crore.
"FIIs have exposure in the Dubai markets. So they were selling their holdings in India. Domestic institutional investors gave some support to the market," Mathew said.
Taurus Mutual Fund Managing Director R K Gupta said, "Indian market movements will depend on how the global markets fare. As no more bad news is coming from Dubai, we can expect some recovery in the Indian markets although the bias will be negative."
Indian markets would find its support around 16,300 levels for Sensex, analysts said.
The US markets on Friday closed in the red with the Dow Jones ending down 154 points or 1.5 per cent at 10,309.92 points. The US markets were closed for a holiday on Thursday when other global markets suffered steep losses. On Friday the US markets opened in a shorter trading day.
Besides, Asian markets also closed down on Friday with the Japan's Nikkei index
MUMBAI: If you want to know ‘the power of small’, the best person to ask is a small-cap mutual fund investor. Small- and mid-cap funds that
Tips to pick potential stocks | Tips for range-bound markets | Risk while investing in midcaps | Follow 20-20 rule for better returns |
According to fund managers, though the market has run up over the past one year, hurtling stocks to the expensive zone, there are still factors that could sustain small- and mid-caps rally for some more time. While sector frontliners have run ahead in terms of valuations, there are several mid- and small-cap stocks that have relatively more upside to grow in value.
In terms of earnings growth, several mid- and small-cap companies have beaten their larger peers (though business turnover of smaller companies is anything but significant to compare with large-cap companies).
“The best thing about a small company is that minor improvements in corporate numbers or working style reflect on their stock price. Small improvement here and there contribute so much to their stock price,” said A Balasubramanian, CEO, Birla Sunlife Mutual Fund.

According to fund managers, small companies with good management vision and ability to offer rare products or services make it to fund portfolios. Though large-cap stocks tend to balance the earnings capacity of a portfolio, it is lesser-known volatile stock groupings that give the portfolio an extra ‘gain-kicker’. If one were to see small- and mid-cap businesses that made it big over the past few years, companies such as Hero Honda (the larger peer being Bajaj Auto), Maruti (the larger peers — M&M and Tata Motors), Marico and Godrej Consumers (the larger peer being HUL) would top the list.
“Spotting a potential multi-bagger is the key to small- and mid-cap fund management. Small-cap fund managers do thorough research before allocating money to smaller companies. The general belief is that if a small-cap company is doing well, it will match up to large-cap companies in terms of returns,” Mr Balasubramanian added.
MUMBAI: Markets regulator SEBI has said that the exchange-traded currency futures market is more efficient than the over-the-counter (OTC)
SEBI’s statement made in an internal memorandum to its board has come as a surprise to many analysts since internationally, the forward market is much more liquid than its exchange-traded counterpart.
The market regulator has studied trends in currency futures and the OTC market and concluded that the former has been operating at a bid-ask spread narrower than that of the OTC spot market. Now, analysts are seeing this as a prelude to the regulator introducing futures contracts in currencies other than the dollar-rupee.
Volumes in listed currency futures have grown phenomenally well since August when they were first introduced with contracts of over $3 billion being traded daily in November 2009. SEBI says this rise that has allowed almost all of the FX futures transactions at NSE amid MCX-SX to take place at a spread less than or equal to half a paisa. The corresponding figure for the OTC market is 6.53%, SEBI said.
The bid-ask spread gives an indication of the cost and ease with which a contract can be traded, essentially a proxy for a market’s liquidity. In a recent research paper, Gurnain Kaur Pasricha, a senior analyst at bank of Canada said Brazil is the only country in the world, prior to India, where the currency futures market has become more liquid than the forward market.
“Once the exchange (traded market) becomes liquid, the network externality of market liquidity sucks in further order flow and preserves the domination of the exchange, even after these rules (helping the segment) are removed,” she concluded in the paper.
The SEBI study also says the share of merchant (corporates) transactions in the OTC market has fallen from 63% in November 2008 to 30% in November 2008. This could mean that as a hedging tool, merchants are probably moving to the futures market, the memorandum said. U Venkatraman, executive director, MCX Stock Exchange attributes this to banks offering the product to customers encouraging participation from exporters, importers and other small and medium enterprises.
Entities other than banks and retail investors made up around 65% of daily volumes in August 2009 for FX futures. While the futures and forward rate diverged initially, they have appeared to converge recently, was another of SEBI’s observation. This underscores the gradual disappearance of arbitrage opportunity between the two markets.
Take advantage of Recognia's research which has identified possible entry and exit points for trades based upon their Technical Analysis tools, as a complement to your other investment research.
Recognia currently analyses 0,000's of financial instruments each day from around the globe, using patent-pending pattern recognition algorithms and neural networking technology. Recognia then systematically analyses the pricing data for these financial instruments overnight, producing charts for each security and automatically detecting current and historical chart patterns. The technology used by Recognia is proprietary, and has been developed and validated by experts in the field of technical analysis.

When we begin our trading journey, we will stumble many times. If we persist, we begin to learn from our mistakes. Our lessons are memorised and knowledge begins to flow into our action plan. We begin to make unconscious trading decisions, based on our past experiences.
Some will call this trading in the moment. Others call it trading in the zone. Whatever you call it, you want to aim for this state. It will take time and patience, so persist, because like expert knowledge any endeavour, it is worth the effort.
As traders we tend to face 4 trading fears. One fear is to lose our money. Another fear is to be proven wrong in our trades. There are two minor fears, which relate to missing out on moves in the market as well as leaving money on the table.
There is no magic cure for any of the ills, but there is a cure. It is called a trading diary. By logging your trades, preferably by taking a snapshot of the chart before and after the trade, you will begin to identify your strengths and your weaknesses. If you persist with this method, you will significantly speed up your learning curve.
So the final lesson is to ride the trend or jump on board a trend, which is already in motion. On the chart below you will see two old familiar concepts. One is the Stochastic Indicator and the other is a moving average on the price chart itself.
The method is simple: you identify the direction of the trend. On this chart we use a 20-period MA on the FTSE 100 (UKX). It is pointing down. So you will be looking for an entry to short sell the market.
On the lower half of the chart I have placed a simple stochastic indicator. I am looking for the stochastic indicator to reach above the horizontal black line, or close to it, and then for the blue line (fast stochastic) to cross over the red line (slow stochastic). I will ignore all the "buy" signals because the trend is pointing down. If the trend was pointing up, I would ignore all the "sell" signals.
This method is simple to use, and it ensures you are trading in the direction of the trend, rather than against it. It also has the advantage that you will most likely not overtrade, as there tend only to be a couple of signals in any given trading day.
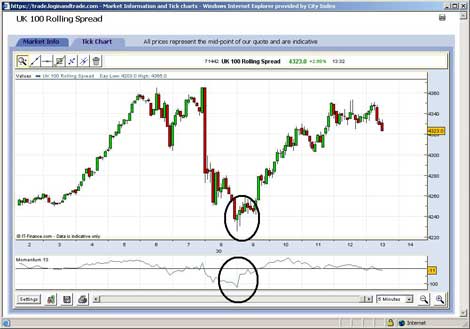
"At times it is better to be out, wanting to be in, than be in, wishing you were out" S Jadeja. The quote above reflects well the constant dilemma that faces an active trader. If I enter the market now, what can I lose? We constantly monitor ourselves for impatience, greed as well as fear. Overtrading in particular is a problem for many traders, experienced or otherwise. Waiting for the right signal can be as testing for your patience as being in the trade. In this article we will discuss a price analysis tool called Candlestick analysis, and combine it with an indicator called Momentum. Momentum is a simple indicator showing the difference between the current closing price and the close N periods ago. On the chart below we are using 5-min bars. Momentum in general refers to prices continuing to trend. The momentum indicator shows the trend by remaining positive while an uptrend is sustained or negative while a downtrend is sustained. A crossing up through zero may be used as a signal to buy, or a crossing down through zero as a signal to sell. Alternatively you can use an abrupt trend change in Momentum as confirmation that a price pattern signal has formed. A price pattern signal can be something as simple as a bar where the close and the open are equal or almost equal. The bars you are seeing on the chart are called "Candlestick" bars. They display the same data as a bar chart, namely the open, the high of the bar, the lows of the bar, and the close. However, a Candlestick is given a color, depending on whether the close is higher or lower than the open. If the close is higher than the open, it is given a green color. Otherwise the bar is red. A particularly popular pattern is the Doji, where the open and close is almost the same. In this instance, the sellers pressed the market lower than the previous bar, but were unable to close the bar at the lows. Instead buyers began to exceed the supply into the market, and the close was near the open. This is a classical reversal pattern in Candlechart terminology, but on its own, it is not particular reliable. However, if you get a confirmation from a sharp reversal in Momentum as well, you increase the odds significantly for a profitable trade. You should enter the market once the next bar trades above the high of the previous bar. Your stop-loss should be placed just below the low of the reversal bar. The philosophy here is to increase the probability of success in our trading by having more than one reason for executing a trade. In this case we had a momentum and price signal. Use our CFD and Spread Betting trading platforms or CFD simulator and Spread Betting simulator to access TA charting tools.
The much maligned "Short Seller" profits from other people's misery and is not a popular face in times of fear and uncertainty. The past year have seen the terms "shorting" and "short selling" come into the public domain but no one feels sorry for the Short Seller in bull markets.
One of the stocks which were high on the wish-list of the short-sellers were Bradford & Bingley (BB-). The stock peaked in April 2006, but the real short-signal came in June 2007, when B&B began to trend lower. Remember once you see a series of lower highs and lower lows, you have a downtrend in place.
You can use different tools when you asses a stocks trend. One such tool is the moving average (MA), which is simply the average price over a specified period of time. On the chart, which is taken from our Spread Betting trading platform, you will be able to see a menu which allows you to specify your moving average settings. This is also available on our CFD platform.
We have chosen to have two moving average price lines on the chart, this is because if a trend is reversing, the shorter moving average will give you a signal before the longer moving average does.
We have used a 20-day MA, and will wait for it to cross over the 50-day MA for a signal. All this can easily be set on the spread betting platform at Interactive Investor. We are waiting to see the market to be making lower highs and lower lows before short a stock using a 20-50 period MA crossover method.
The method is simple, and works great in trending markets. You can also use it on shorter time frames when you trade the markets intra-day. One downside with the MA crossover method is that it performs poorly in a market with no trend or direction, also known as a range bound market.
"Once a trend sets into motion, it tends to stay in motion"
Translated this means that the odds of the trend continuing are higher than of it reversing. However, many traders like to trade reversals, if they can spot one. One of the tools that can be used for trading a reversal is a trendline.
A trendline is a line drawn on a chart which to the greatest possible extent captures the trend in the market. It draws a line above or below the market, by connecting two points on the chart. The theory behind trendlines is that as long as the trendline remains intact, it pays off to continue to buy the small countertrends.
Once the trendline is broken, it is time to get onto the new emerging trend. At least this is the theory behind it, but it is of course not always as straight forward. You can use trendlines to trade currencies. Currencies have an amazing disposition to trend. If you trade them on a 4-hour chart it cuts away the noise of intra-day trading. Noise is another word for short-term volatility. By using a longer time frame you are able to capture the true underlying trend.
So what are the pros and cons of trading a trendline on a longer-term chart? One of the advantages is that the signals are reliable due to the length of the chart time frame. It is important to remember that there has to be congruency in your expectations of the trade.
There is little point in expecting that a trendline break on a 5-min chart will set up a longer-term swing trade lasting days or weeks. If you don't want to be tied to the screen all the time, a good compromise is a longer-term chart offers me, it is still speculation but over days rather than minutes.
One disadvantage you have to take into account is your stop-loss. You need to place a stop-loss when you enter a position. As you are trading over a longer time frame, you could place a larger stop-loss. The reason is that you don't want your stop-order to be caught by the random noise in the market.
You only want to be stopped out if the trend reversal does not materialise. This means that a stop can be as much as 75-100 points or "pips" as it is called in the currency market. You can compensate for the large stop-loss by trading a smaller size.
On our trading platforms it is easy to place trend lines. The trendline break indicated that the Sterling Dollar rate would decline. And although the move took some time to materialise it was a good trending move.
Use our CFD and Spread Betting trading platforms or CFD simulator and Spread Betting simulator to access TA charting tools.
There are advantages and disadvantages of trading with an oscillator. There are various kinds of oscillators, but they all serve to highlight one thing in the market:
Is the market overbought or is it oversold?
The oscillator will fluctuate between 0 and 100. We have chosen to demonstrate the principle of the oscillator using Stochastics. You can also use oscillators such as Williams % R (copy-cat of Stochastics), as well as RSI. You don't need to know all of them, or for that matter any of them, but when you start out on your trading, they can be a guiding light.The Stochastics here has been set at 8-3-1, in order to show one line only. Normally Stochastics will display two lines. One is known as the fast Stochastics, and the other is known as the slow Stochastics. Traders are looking for the fast line to cross the slow line for a buy or sell signal. We have not shown that here for the sole reason I want to highlight the principle of the Stochastics Oscillator as clearly as possible.
The chart shows gold in a sideways range, followed by "price discovery" break to a new range...we have emphasized the range by the us e of two horizontal blue lines, which captures most of the trading over the course of 6 months. The oscillator's job is to highlight when a market is overbought or oversold, and look how well it is doing this on the chart. The red circles on the oscillator correspond to tops in the market. The same can be said for the green circles which catch the lows in the market so well.
Be aware that you can notice how quick an Oscillator like Stochastics can mess with your trading performance during trending markets. The vert ical blue lines on the chart zooms in on how quick the Stochastics goes into "oversold" territory, and yet Gold continues to fall. As a matter of fact Gold turned "oversold" at $900, yet it continued to fall for another $150. That would have been a costly error to buy.
Conclusion:

Use our CFD and Spread Betting trading platforms or CFD simulator and Spread Betting simulator to access TA charting tools.
Technical Analysis (TA) is seen by many experts and pundits as a useful alternative to fundamental analysis.
However, in the past some dedicated supporters of fundamental analysis have looked down their noses at TA, suggesting it's no more effective than reading tea leaves. So it may come as a surprise to learn TA is used by such successful investors as Mark Mobius, fund manager at Franklin Templeton.
Check out Money Observer's editor Andrew Pitts interview with Mark Mobius on iBall TV.
At Interactive Investor we believe TA and fundamental analysis go hand in hand - which is why we offer a comprehensive set of share factsheets and a derivatives platforms complete with powerful technical analysis tools.
We have presented a series of educational articles on TA explaining how you can use the major chart patterns, featuring such illuminating names as Moving Averages, Oscillators and Bollinger Bands.
If you apply these to recent shares and indices movements you can get a real understanding of how to apply them in your own trading.
The power of TA is that it gives you an indication of where a price may be headed using some simple tools, without the need to spend days researching company reports (check out our free service for company reports). You can then use resources such as our factsheets to double check there are no fundamental company issues with a potential investment you've picked using TA.
We have built our CFD and Spread Betting platforms around our TA tools so you can identify potentially profitable opportunities in a wide range of investments, eg shares, indices, commodities and forex, in major world markets. This gives you the ability to trade around the clock.
Spread Betting complements share dealing as it allows you to hedge and, because of its leverage, you can hold more positions with the same amount of capital, allowing you to diversify your portfolio.
So what is the origin of TA? It can be traced back to Japanese rice traders thousands of years ago but it is only some 100 years ago that the real rule based foundation was laid.
Charles Dow, an editor of the Wall Street Journal and the inventor of the Dow Jones Industrial Average Index, penned a series of editorials which we refer to as "Dow Theory". These editorials reflected Mr Dow's beliefs that the stock market discounts all available information and how the market could be used to measure the health of the business environment. Much of what we know today as technical analysis has its roots in Dow's work.
For the technical analyst there is only one God. It is the current price. It reflects demand and supply, which in turn reflects the combined emotions of hope, greed and fear of the participants in the market.
Charles Dow argued that the markets and the economy trends, like Newton's first law states "once an object is propelled into motion, it tends to stay in motion". In other words, once a market begins to move higher, the odds favour that it will continue to move higher.
Within these major trends, which Charles Dow called the Primary Trend, we can have smaller trends which temporarily move contrary to the primary trend. This concept is illustrated in the graph below. As long as the last low is higher than the previous low, the trend is up. Once this pattern changes, the trend is said to have changed too.So what is the Dow Index saying in this chart? It has already priced in a significant downturn in the market, and there is no silver lining on the horizon just yet, at least not on the chart. So remember that once a trend sets into motion, it tends to stay in motion, irrespectively if it is a stock, a commodity, a currency or an index, and trends always tend to go much further than most believe.
Interactive Investor is committed to providing our clients education to support their trading strategies, we have two TA tools: the first is our Technical Insight package provided by Recognia which can be accessed via the links below, the second is our charting system on our trading platforms which can only be accessed by account holders. To use the charting tools on the trading platform click the 'Tick Chart' icon next to the instrument and set your TA indicators and adjust your time period according to the period you wish to review.
To open a CFD position, you need to deposit only a fraction of the full value of your trade, typically around 10-30 per cent. CFD trading therefore offers the possibility of a return on your initial investment without paying for the trade in full.
A CFD (Contract for Difference) is an agreement to exchange the difference between the opening and closing value of a contract at its close. Rather than buying or selling the underlying instrument on which your contract is based, you simply place a trade with us. The price of your CFD will then replicate the price of the underlying asset giving you a profit or a loss as the price of the underlying asset moves.
CFDs are a way of trading on the price movements of the world’s financial markets around the world without buying or selling the underlying asset. They provide the opportunity to profits or loss from 000’s of markets such as equities, indices, currencies and commodities. CFDs can be used to speculate on price movements whatever the direction, making them a flexible alternative to traditional share trading.
Today There is Investigation for All employees working In Forex Peace Army or FPA. This investigation is due to 100s of complaints for many frauds happened.
Money Laundering
Credit Cards Frauds
Breaking The United State Commercial Laws
Tax Frauds
The Investigators was from the U.S. Department of the Treasury (Financial Crimes Enforcement Network) [http://www.fincen.gov], Federal Bureau of Investigation
They Decided To Closed the website till the investigation is done. The investigation is about payment through credit cards and paypal.
Many Traders saying that “My Credit Card is Finished at once” “Where is My Money” FPA Replied with that the frauds came from your banks ![]() HOW COME?
HOW COME?

This Reveal The Size of Scam that we are dealing with as Nigerian, American, German, Brithish, Indonisian, ….. etc. It’s over and more to hear that Governmental Institution investigation with Felix Homogratus ans Rob and all Employees working in Forex Peace Army because all of them are the same n Forex Society Weapons.
Scam Till The End, I’m Still warning all Traders and All people from using these kinds of services and dealing with those bastards.
Can I ask you a small Question: What Will You Do If This Website is closed?
Did I tell that the address that they are providing is FAKE Address?
Yes is Fake
Address for Appartment owned by someone called Vin William
Today There is Investigation for All employees working In Forex Peace Army or FPA. This investigation is due to 100s of complaints for many frauds happened.
Money Laundering
Credit Cards Frauds
Breaking The United State Commercial Laws
Tax Frauds
The Investigators was from the U.S. Department of the Treasury (Financial Crimes Enforcement Network) [http://www.fincen.gov], Federal Bureau of Investigation
They Decided To Closed the website till the investigation is done. The investigation is about payment through credit cards and paypal.
Many Traders saying that “My Credit Card is Finished at once” “Where is My Money” FPA Replied with that the frauds came from your banks ![]() HOW COME?
HOW COME?
Traders
MB Trading SCAM Case | Reobert Grespi
September 24, 2008 · Leave a Comment
MB Trading Admitted that they are the biggest SCAM group in the web, I will give you proof from inside and outside the website:
- Have you read the trading agreement:
You Can Open this link and follow my post
https://www.mbtrading.com/fx/secure/doc/3.pdf?SAgreementDocTypeId=3
15. REMEDIES
(h) MBTF in its discretion reasonably deems it necessary for its protection, MBTF shall have the right, in addition to any other remedy available by law or in equity, to (iii) cancel any or all pending orders, refuse to accept new orders and/or refuse to enter into new contracts with Customer, all without liability on MBTF’s part to the Customer or any third party.
- After Reading this all traders drew back and stop signing up for new accounts and for the traders that funded and added the deposits will stays years searching for the fund.
NFA will not solve the issue if you are not USA citizen because all rules are applied for the traders living in USA and citizens.
MB Trading don’t accept USA citizens and this is the greatest surprise
“MB Trading after all the bad reputation Acquired EFX Group” and this was the greatest lie I ever seen.
EFX Group was acting as introducing broker for FXCM but they didn’t mention that in the website. After asking Kathy (employee in FXCM dealing room) she said that EFX Group has no account with FXCM till now. WOW
Robert Grespi or Rob or Pharaoh has said before in ForexPeaceArmy:
SO, this reveals that they are owned by MB Trading.
And we have motioned before that MB Trading owned by Felix
So, EFX Group and MB Trading just a websites like ForexPeaceArmy, secretnewsweapon,
MB Trading Admitted that they are the biggest SCAM group in the web, I will give you proof from inside and outside the website:
- Have you read the trading agreement:
You Can Open this link and follow my post
https://www.mbtrading.com/fx/secure/doc/3.pdf?SAgreementDocTypeId=3
15. REMEDIES
(h) MBTF in its discretion reasonably deems it necessary for its protection, MBTF shall have the right, in addition to any other remedy available by law or in equity, to (iii) cancel any or all pending orders, refuse to accept new orders and/or refuse to enter into new contracts with Customer, all without liability on MBTF’s part to the Customer or any third party.
- After Reading this all traders drew back and stop signing up for new accounts and for the traders that funded and added the deposits will stays years searching for the fund.
NFA will not solve the issue if you are not USA citizen because all rules are applied for the traders living in USA and citizens.
MB Trading don’t accept USA citizens and this is the greatest surprise
“MB Trading after all the bad reputation Acquired EFX Group” and this was the greatest lie I ever seen.
EFX Group was acting as introducing broker for FXCM but they didn’t mention that in the website. After asking Kathy (employee in FXCM dealing room) she said that EFX Group has no account with FXCM till now. WOW
Robert Grespi or Rob or Pharaoh has said before in ForexPeaceArmy:
SO, this reveals that they are owned by MB Trading.
And we have motioned before that MB Trading owned by Felix
So, EFX Group and MB Trading just a websites like ForexPeaceArmy, secretnewsweapon, alansforexblog, forexdiamond, spartanforexfund, wpips, kingforexsignlas, forexbastard.
Fundamental Outlook at 1500 GMT (EDT + 0500)
€
The euro lost ground vis-à-vis the U.S. dollar today as the single currency tested bids around the US$ 1.4830 level and was capped around the $1.5015 level. The market was quite volatile on account of a few factors. First, traders remained skittish and attentive to the Dubai World situation. Dubai’s largest corporate entity on Wednesday asked creditors for a six-month standstill agreement on debt repayments. The entity’s total liabilities aggregate around US$ 60 billion and there are some concerns that other emerging market debtors could experience similar problems through contagion. Premia for emerging market debt in the fixed income market have increased over the past two days. The U.S. dollar has really been on the back-end on a trading strategy that has been long risk and short the greenback for several months. The paring of risk that has been associated with the Dubai situation could positively impact the U.S. dollar. Second, traders are closely watching the yen and any potential Japanese response to the yen’s recent appreciation. Third, liquidity was reduced during the North American session on account of yesterday’s Thanksgiving Day holiday. Data released in the U.S. today saw October building permits revised to -4.2% from -4.0%. Data to be released on Monday include the November Chicago purchasing manager index. In eurozone news, European Central Bank member Ordonez said the “euro interbank market…has suffered greatly” as a result of the global financial crisis. Data released in the eurozone today saw November industrial confidence rose to -19 from -21 while November economic confidence improved to 88.8 from 86.1. Also, November consumer confidence increased to -17 from -18 in October. Additionally, the October import price index rose 0.5% m/m and was off 8.1% y/y. Euro bids are cited around the US$ 1.4720 level.
¥/ CNY
The yen depreciated vis-à-vis the U.S. dollar today as the greenback tested offers around the ¥87.00 figure and was supported around the ¥84.85 level. The pair rallied higher from multi-year lows dating to 1995 as traders booked profits on their short yen positions. Nervousness increased regarding the possibility of yen-selling intervention by Japanese and foreign monetary authorities. Finance minister Fujii noted “this kind of situation is sustained, I think that it would be something abnormal. It would be possible for us to take” action. Fujii added he is “extremely nervous and is watching the market carefully…there’s no doubt the market has moved too far in one direction.” While some dealers do not believe the Japanese government will conduct yen-selling intervention at current levels, Japanese exporters are finding it more difficult to grapple with the yen’s ascent. Chief Cabinet Secretary Hirano reported “Excessive moves are undesirable. The government will monitor the impact of the currency market on the economy. We'll make sure that the yen rise will not lead to a second bottom in the economy, and the upcoming extra budget will be compiled with such risk in mind.” Data released in Japan overnight saw the October overall retail sales index off 0.9% m/m, better-than-expected, while October core consumer price inflation was off 2.2% y/y. These data suggest deflation could continue in Japan for quite some time. Also, the October jobless rate improved to 5.1% from September’s reading of 5.3% while October all household spending was up 1.0% m/m and +1.6% y/y. Finally, Japan’s trade deficit printed at ¥126.81 billion in the first ten days of November, off 2.1% y/y. The Nikkei 225 stock index lost 3.22% to close at ¥9,081.52. U.S. dollar offers are cited around the ¥94.75 level. The euro moved lower vis-à-vis the yen as the single currency tested bids around the ¥126.85 level and was capped around the ¥130.15 level. The British pound moved lower vis-à-vis the yen as sterling tested bids around the ¥139.25 level while the Swiss franc moved lower vis-à-vis the yen and tested bids around the ¥84.20 level. In Chinese news, the U.S. dollar depreciated vis-à-vis the Chinese yuan as the greenback closed at CNY 6.8264 in the over-the-counter market, down from CNY 6.8270. People’s Bank of China Deputy Governor this reported the yuan will become a “more attractive currency” and added the central bank will increase surveillance of hot money flows. Vice Foreign Minister Zhang Zhijun this week said China will “increase the flexibility of the yuan exchange rate while maintaining stability in the market,” adding the increase will be “incremental and balanced.” Zhang added China is moving toward a system “that is market-based and is a managed floating mechanism with respect to a basket of currencies.” Chinese Premier Wen Jiabao will meet European Central Bank President Trichet and Ecofin head Juncker on 29 November. China’s banking regulator informed Chinese lenders they must comply with capital requirements or risk sanctions. There is increasing speculation China will strengthen its strict capital requirements.
₤
The British pound came off vis-à-vis the U.S. dollar today as cable tested bids around the US$ 1.6270 level and was capped around the $1.6520 level. Sterling has come off about 300 pips over the past three trading days as dealers have reacted to the Dubai debt market shock. Bank of England Monetary Policy Committee member Posen reported wholesale reform is needed if the U.K. banking system is going to mount a sustainable recovery. Chancellor of the Exchequer Darling downgraded the U.K.’s 2009 economic growth outlook today and now sees shrinkage of 4.75%, worse than the previous -3.75% forecast. Cable bids are cited around the US$ 1.6155 level. The euro moved lower vis-à-vis the British pound as the single currency tested bids around the ₤0.9060 level and was capped around the ₤0.9135 level.
Technical Outlook at 1330 GMT (EDT + 0500)
(Bid Price) (Today’s Intraday Range)
EUR/ USD 1.4957 1.5015, 1.4828
USD/ JPY 86.78 87.01, 84.83
GBP/ USD 1.6490 1.6519, 1.6270
USD/ CHF 1.0072 1.0176, 1.0020
AUD/USD 0.9056 0.9135, 0.8945
USD/CAD 1.0627 1.0747, 1.0579
NZD/USD 0.7085 0.7165, 0.7022
EUR/ JPY 129.79 130.14, 126.86
EUR/ GBP 0.9071 0.9133, 0.9058
GBP/ JPY 143.08 143.48, 139.26
CHF/ JPY 86.16 86.40, 84.22
Support Resistance Support Resistance
EUR / USD USD / JPY
L1. 1.4470 1.4915 88.60 93.30
L2. 1.4355 1.5140 87.10 95.50
L3. 1.4175 1.5360 86.10 98.85
GBP / USD USD / CHF
L1. 1.6115 1.6685 1.0275 1.0580
L2. 1.5720 1.6830 1.0040 1.0695
L3. 1.5405 1.7040 0.9750 1.0885
AUD / USD USD / CAD
L1. 0.8450 0.8830 1.0535 1.0945
L2. 0.8300 0.9050 1.0365 1.1125
L3. 0.8070 0.9120 1.0155 1.1355
NZD / USD EUR / JPY
L1. 0.6880 0.7125 131.45 135.75
L2. 0.6750 0.7260 129.75 136.90
L3. 0.6535 0.7395 127.00 138.75
EUR / GBP EUR / CHF
L1. 0.8795 0.8995 1.5110 1.5380
L2. 0.8675 0.9105 1.4905 1.5580
L3. 0.8320 0.9225 1.4670 1.5880
GBP / JPY CHF / JPY
L1. 146.10 152.50 86.30 88.65
L2. 142.05 157.75 85.40 90.10
L3. 135.70 161.70 81.55 91.60
SCHEDULE
Friday, 27 November 2009 all times GMT
(last release in parentheses)
N/A Germany October import price index (-0.9% m/m)
N/A Germany October import price index (-11.0% y/y)
N/A Eurozone November Ifo business climate survey
0745 France November consumer confidence (-35)
0900 Italy October hourly wages
1000 Eurozone November economic confidence (86.2)
1000 Eurozone November business climate indicator (-1.78)
1000 Eurozone November consumer confidence (-18.0)
1000 Eurozone November industrial confidence (-21.0)
1000 Eurozone November services confidence (-7.0)
1030 CH November KOF leading indicator (1.45)
1330 Canada Q3 current account (-C$ 11.2 billion)
DISCLAIMER: Daily Market Commentary is provided for informational purposes only. The information contained in these reports is gathered from reputable news sources and is not intended to be used as investment advice. We assumes no responsibility or liability from gains or losses incurred by the information herein contained.
You simply register with E-Global Trade & Finance Group, Inc. we offer the easiest and fastest registration out there, with absolutely no obligations. Once you're registered, just make a deposit of the margin amount you choose to begin trading with, and you begin trading on Forex. And only E-Global Trade & Finance Group, Inc. allows you to make your deposit with your credit card.
It just doesn't get any simpler. But if you do need assistance, we offer as much customer service and one-on-one training as you need. And with E-Global Trade & Finance Group, Inc., your help won't come from a computer, but from a living, breathing human being, who speaks your language.
How do I trade on Forex?
For starters, you simply choose which two currencies you want to make a deal with on Forex. You choose the amount of the deal you'd like to make (called the "volume"). You make a deposit to provide the collateral needed for the deal, called the "margin." In most cases, this is just a fraction of the overall amount of the deal? for example, 1%, or 1:100.
You still have the power to "freeze" the deal for several seconds before you finalize it. Freezing allows you to adjust the terms or to accept them as they are. Or, you can call the whole thing off, and cancel the deal. Freezing is a feature offered exclusively by E-Global Trade & Finance Group, Inc. While your deal is still running, you have a so-called "open position." This means that you're able to follow your deal's status and scenarios online at any time. You can make changes to the deal's terms, or you can simply cancel it and either pocket any profits, or minimize any losses. What's more, E-Global Trade & Finance Group, Inc. allows you to set a "take-profit" rate. When and if the market reaches this rate, your deal will close automatically, allowing you to be away from your computer while you have an "open position."
Ready to learn more, or find additional training online. Just register with us, with no obligation, and we will lead you through the process step-by-step.
Again, the answer is obvious: just as with any market, you make money by buying low and selling high! Buy for less, sell for more! All you do is take advantages of fluctuations in the relative values of world currencies. Each currency's value changes every day in the currency exchange market. All you have to do is use these fluctuations to your advantage.
One thing we'd like to mention about currency exchange on Forex: on Forex, these daily fluctuations are actually 100 times greater than the actual fluctuation (for example, around 1%). Generally speaking, E-Global Trade & Finance Group, Inc. can offer trading ratios of between 1:10, 1:100, 1:200 and 1:500. So let's do the math: if the exchange rate of your given pair of currencies increased by just 0.6% over the last few hours, then you'll bag a profit of 60% on your original investment! All of this can happen over the course of a single business day, or as quickly as a matter of minutes.
And best of all, you don't risk losing anything more than your margin! There's absolutely no limit to your possible profits, but you never risk losing anything beyond what you originally invested.
And another thing: you have the power to choose your pair of currencies, and their amount, based on which way the market's headed, and still turn a profit. It makes no difference which way the exchange rate is headed, down or up, because you always have the choice of buying US dollars and selling Yen, or the other way around - buy Yen and sell US dollars. And no, you don't need to actually own any particular currencies, or "have" them in hand, in order to make transactions with them on Forex
It's the market. It's that simple.
More precisely, FOREX is a currency trading market, and it's one of the largest and most rapidly developing markets on the planet. Over 2.5 trillion dollars are turned over on Forex every single day. That's more than 100 times more than the amount turned over daily on NASDAQ. If you're intrigued, you can click here and get more detailed market information from E-Global Trade & Finance Group, Inc.
So, what's a market? Simple: it's a place where goods are traded. Forex is no different, but with one little twist: the goods traded on Forex are the national currencies of the world's countries. For example, on Forex you might pay in American dollars and buy some Canadian dollars. Or, you could sell your Euros for Japanese Yen. There's nothing more to it than that.